
Data & analytics
Own product · built on the Atlas data spineAtlas Company Report
One fiscal code in, a full dossier out.
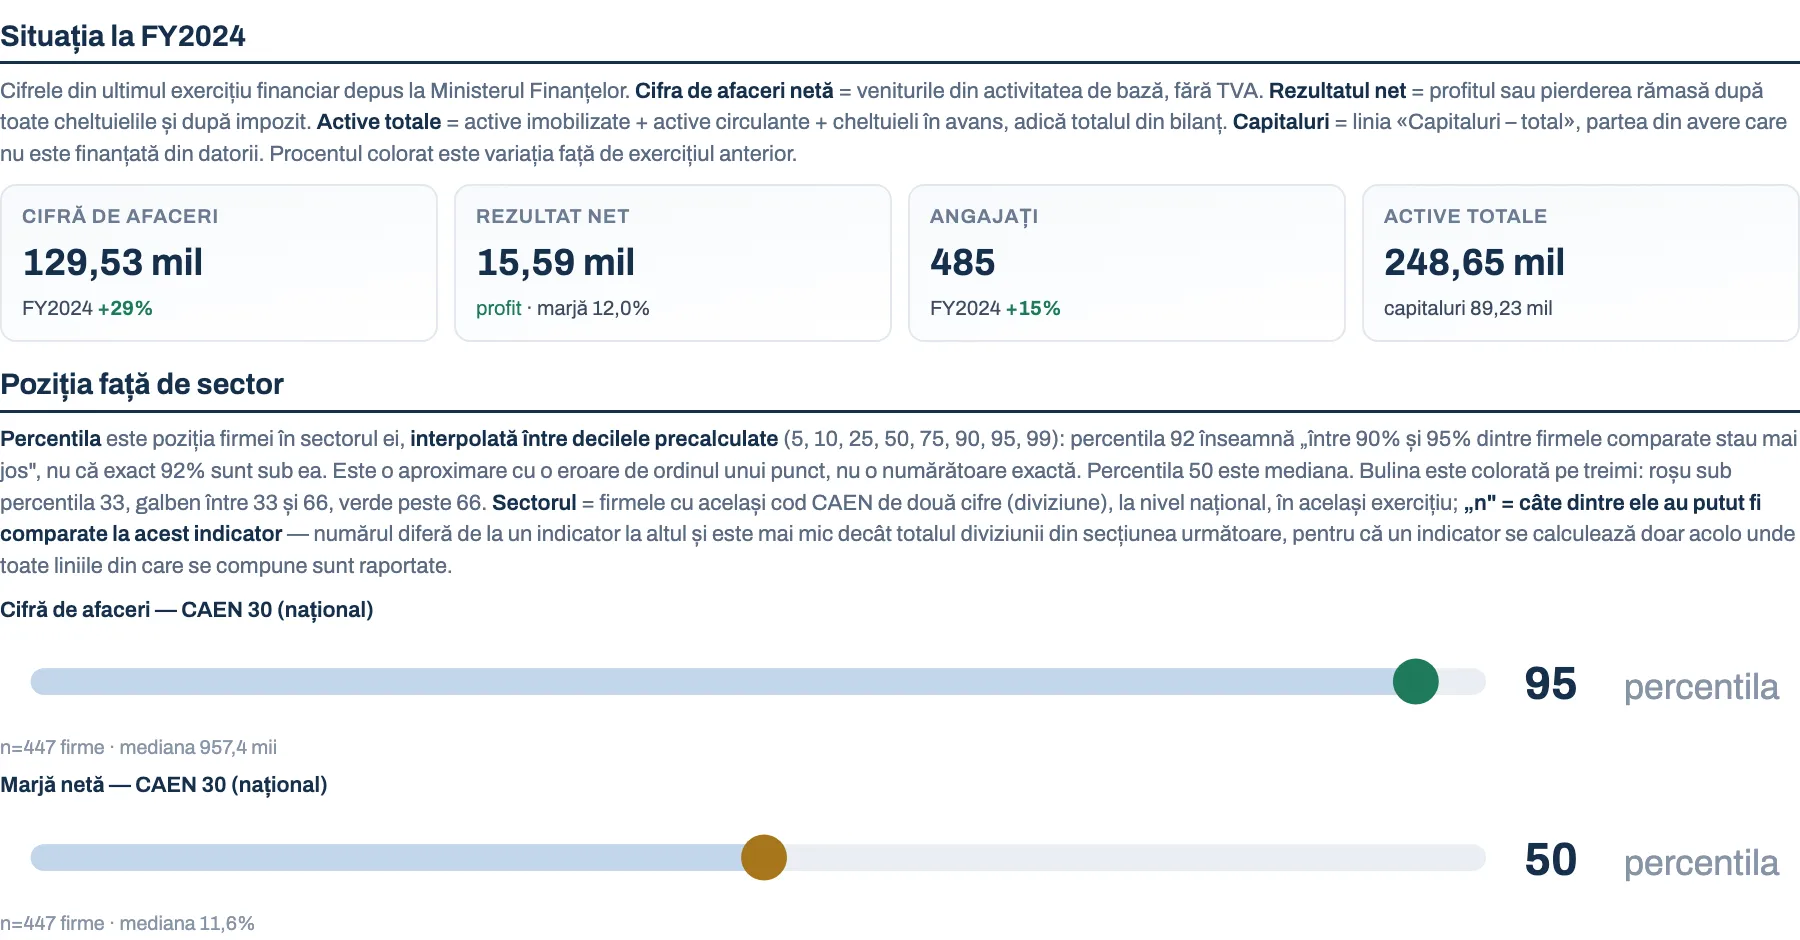
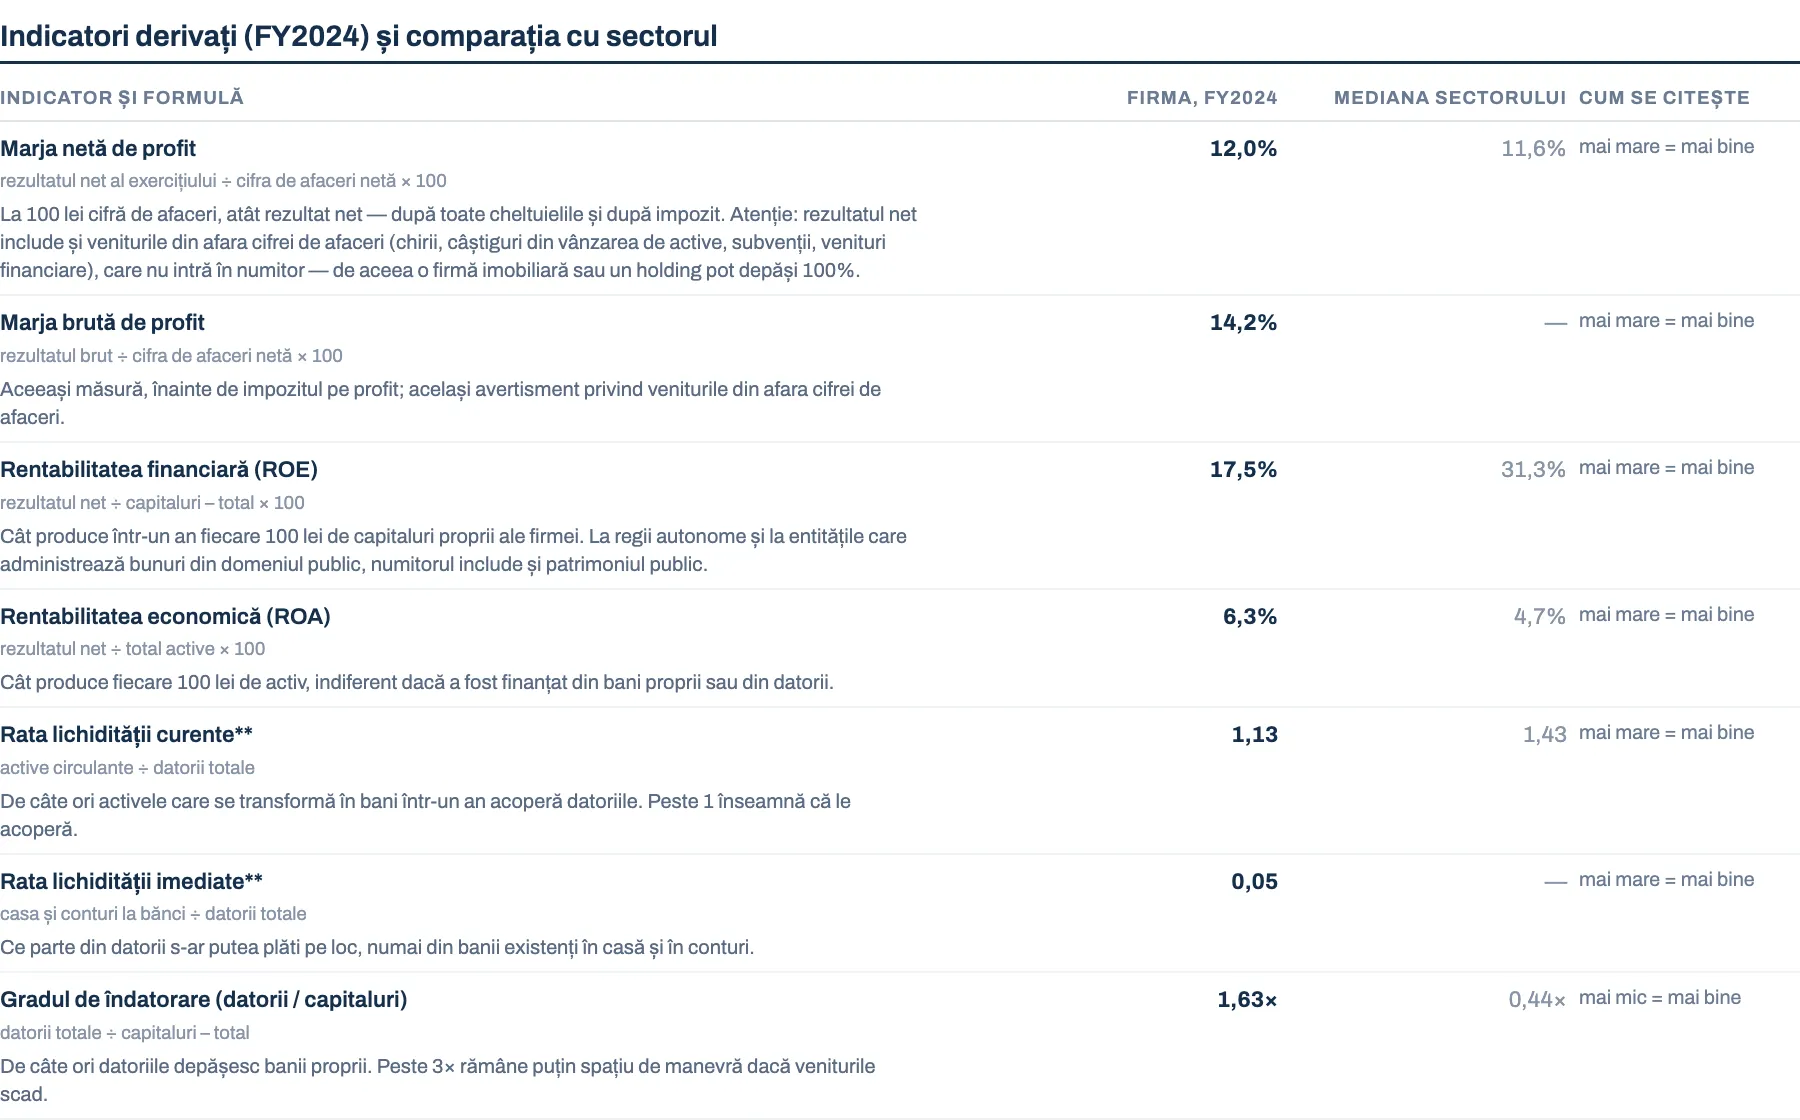
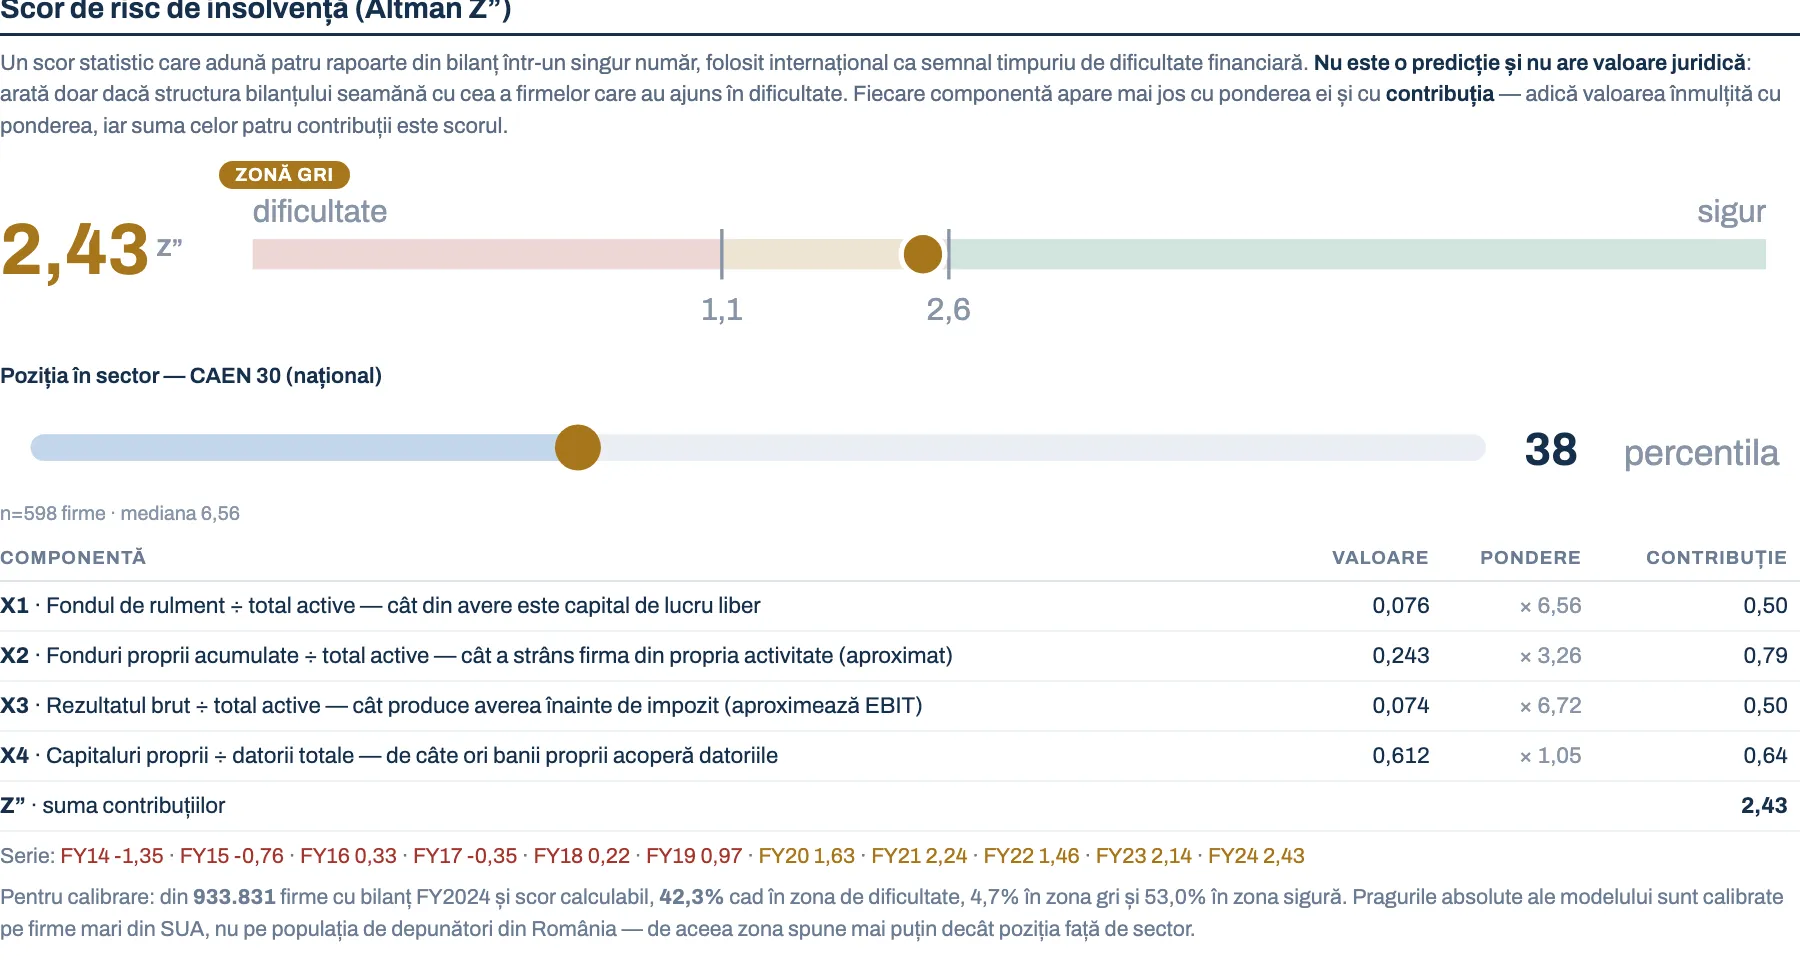
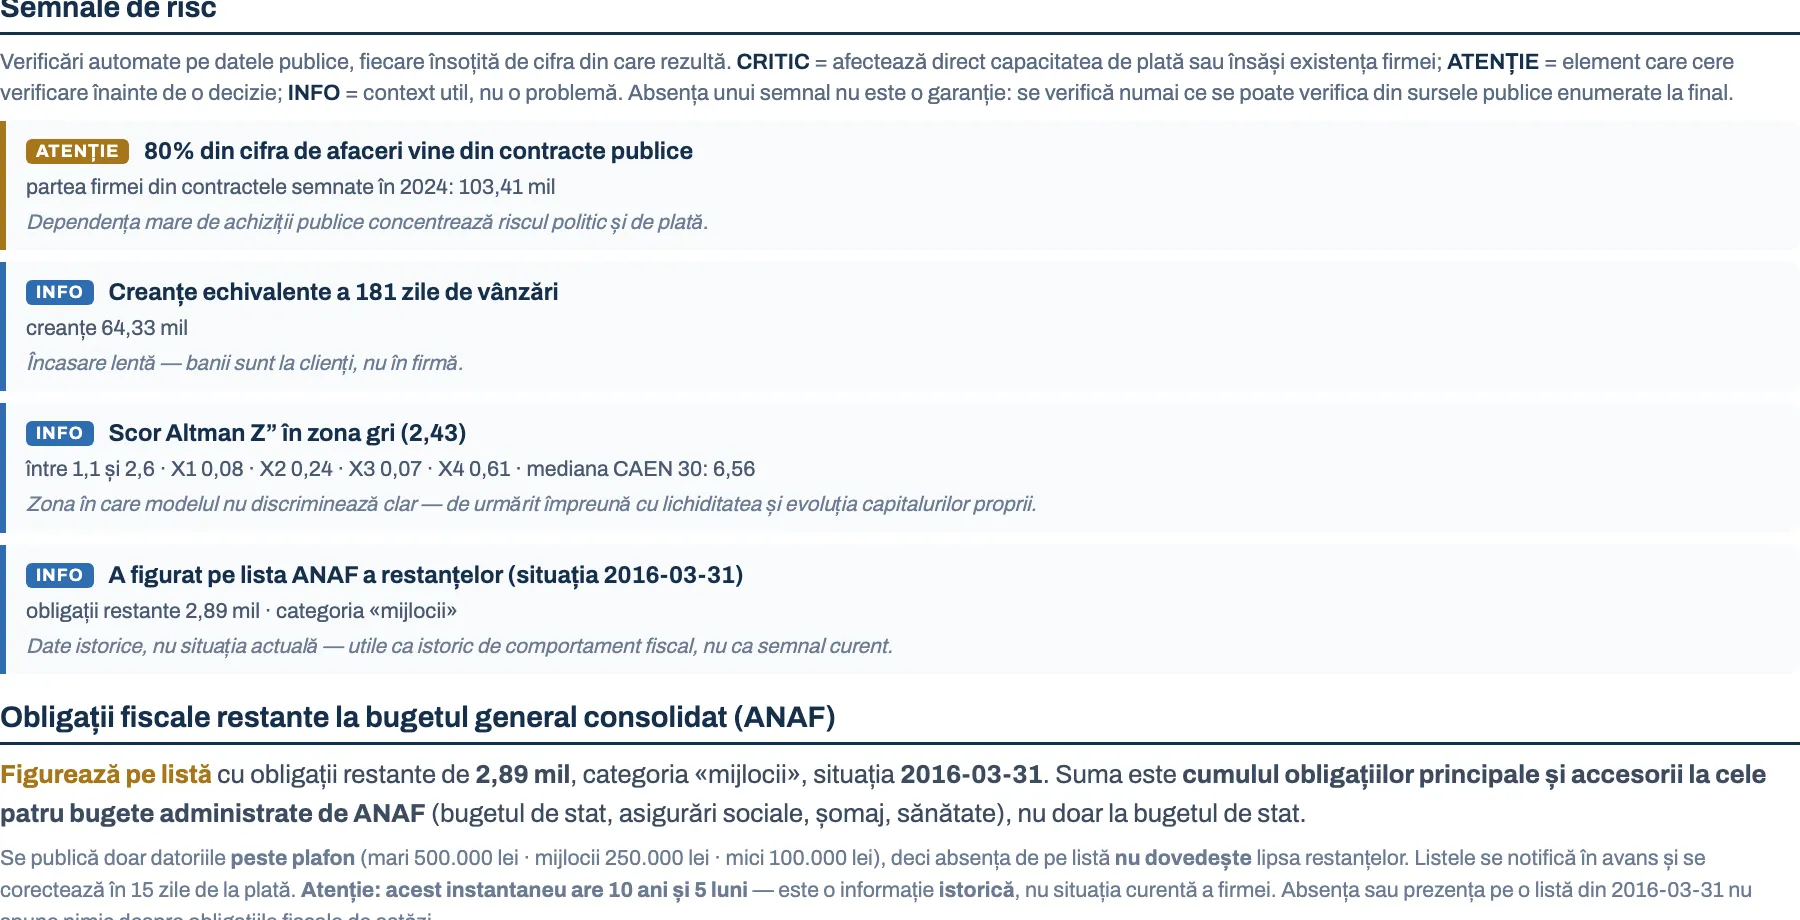
Give it a CUI and it produces a fourteen-section report: identity and legal status from the companies register, fiscal status queried live from the tax authority, eleven years of filed financial statements, position against every firm in the same CAEN division, market size and share, derived indicators against sector medians, an insolvency-risk score, and public-procurement exposure across both the tender and the below-threshold channel. It runs against the same data spine as the Atlas, with no database and no server — point lookups straight at the raw government files, because a fiscal code is unique and a scan finds it in under a second across 2 GB. Peer distributions, the one thing a lookup cannot answer, are precomputed once.
- Open-data engineering
- Financial-statement analysis at scale
- Indicator design & peer benchmarking
- Adversarial verification
Impact
- Column mapping validated independently of the official legend: the balance-sheet identity holds for 100.00% of filings across all three published layouts
- 238 reconciliation checks on the financial sections recomputed from the raw files with no defect; 34 findings from two adversarial audits fixed, including a lookup that returned a different company for 3,005 fiscal codes
- One correction cut a published procurement figure by 32% — the deduplication key could not survive four date formats and 98,064 blank dates
The context
The sources are public and individually near-useless. Financial statements are published as twenty numbered indicators with no column names, in three different layouts across the years. Liabilities arrive as a single total, so no standard liquidity ratio can be computed as defined. There is no cost of goods sold and no retained earnings, so two textbook indicators and two Altman components have to be substituted. The procurement archive writes contract dates four different ways and leaves 98,064 of them blank. None of that is documented anywhere — it has to be discovered, and each defect causes silent data loss rather than an error.
What we delivered
- A one-command generator: fiscal code in, styled HTML and print-ready PDF out, in about twenty seconds
- Coverage of all 4,201,627 entities in the companies register, degrading honestly — the 68% with no filed accounts get a section explaining why, not empty tables
- Peer distributions over 8.7 million filings: 40,000+ groups across CAEN division, section and county, eleven years, eight quantiles each
- Every indicator printed with its formula in balance-sheet line names, a plain-language reading, and the direction that counts as better
- A published methodology that names each forced approximation and states the direction of its bias — or states that the direction cannot be established, where it cannot
Why it matters
- Turns a fiscal code — the one identifier a business always has for a counterparty — into a decision document, without a subscription or a data-room
- The defensible asset is the joining and the verification, not the data: anyone can download the same files and get nothing usable
- Same spine as the Atlas, so county analysis and company analysis can never contradict each other
From the dashboard
What's the real problem in your business?
Let's have a direct, no-pressure conversation about what's getting in the way — and if the answer isn't technology, we'll tell you that plainly.