
Data & analytics
Independent analysis · live micrositeAtlas Economic
Public money, county by county.
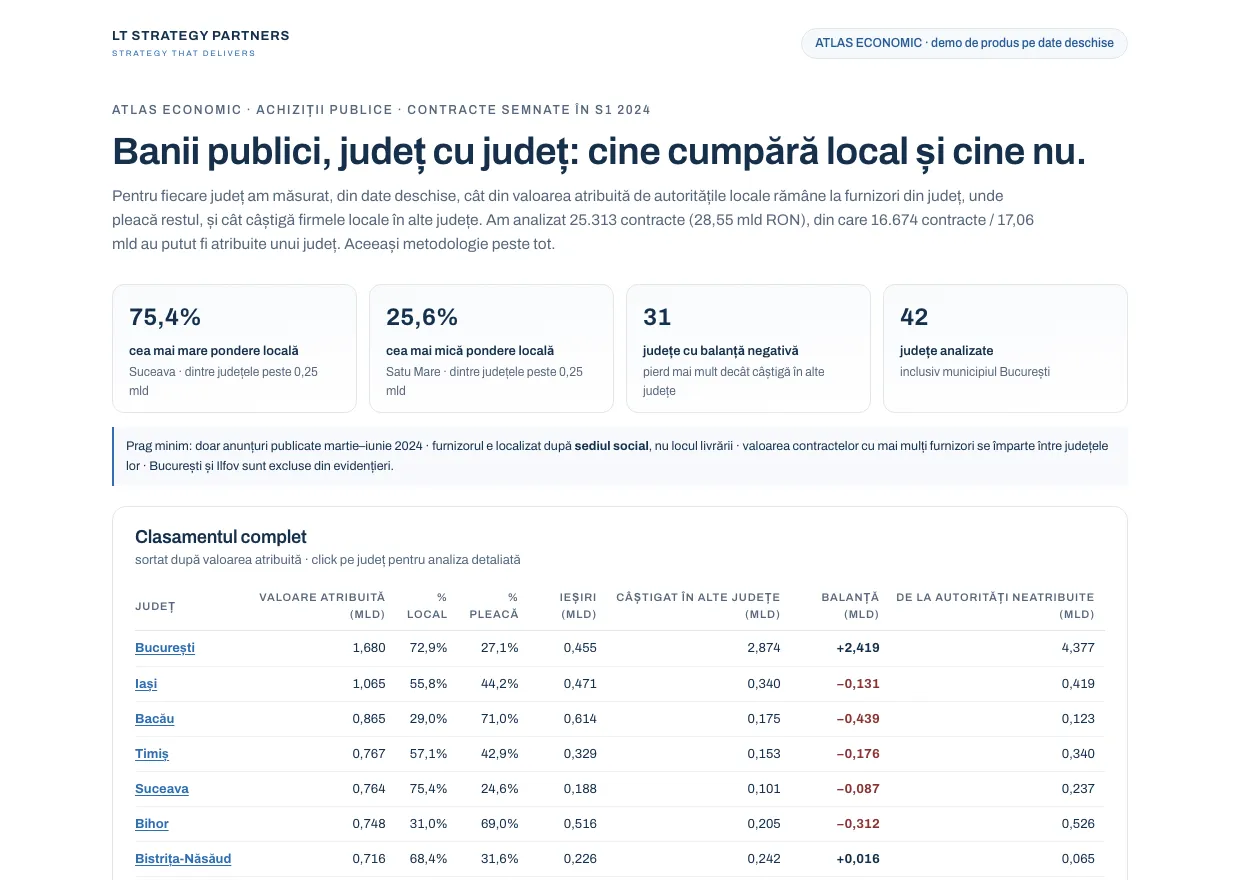
Atlas Economic answers a question no Romanian institution publishes: for each county, how much of what its public buyers award actually stays with suppliers based there, where the rest goes, and how much local firms win back from authorities elsewhere. It joins three open datasets — the procurement system, the companies register, and the official locality classifier — into one symmetric ledger, and publishes a page per county that you can open and check. It is self-initiated — built to demonstrate the method rather than for a client — which is why the pipeline, the methodology and the audit trail are all public.
- Open-data engineering
- Entity resolution & record linkage
- Economic indicator design
- Reproducible analysis & audit trails
Impact
- 43,591 contracts analysed (65.38 bn RON), of which 37.45 bn attributed to a specific county
- 42 counties covered with one identical methodology
- Three rounds of adversarial review by twelve independent reviewers; two full from-scratch reimplementations reproduced every published figure
The context
The raw data is public but unusable as published: award notices carry no county, public institutions are absent from the companies register, framework ceilings look like spending, and the same contract appears once per consortium member. Answering the question at all means resolving buyers to counties, suppliers to registered seats, and money to a ledger that balances.
What we delivered
- A reproducible pipeline over three open sources — a full year of SICAP award notices (three of the four quarters are Excel-only, and the one published CSV is silently truncated), the ONRC companies register (~3.9M entities), and the INS SIRUTA locality classifier
- A symmetric flow ledger: every leu leaving one county enters another, verified against two structural identities to the leu
- 42 county pages plus a national league table, generated as static HTML with no external dependencies
- A published methodology that documents every filter, both possible conventions, and each failure mode found in review
- An audit trail file exposing the weak attributions and everything the method deliberately leaves unattributed
Why it matters
- Turns fragmented public data into an indicator no single institution publishes — the commercial value is in the joining, not the raw data
- Shows a measurement problem handled honestly: the limits are quantified on the page, not hidden
- Demonstrates a pipeline that re-runs each quarter as new data is published, rather than a one-off study
What's the real problem in your business?
Let's have a direct, no-pressure conversation about what's getting in the way — and if the answer isn't technology, we'll tell you that plainly.